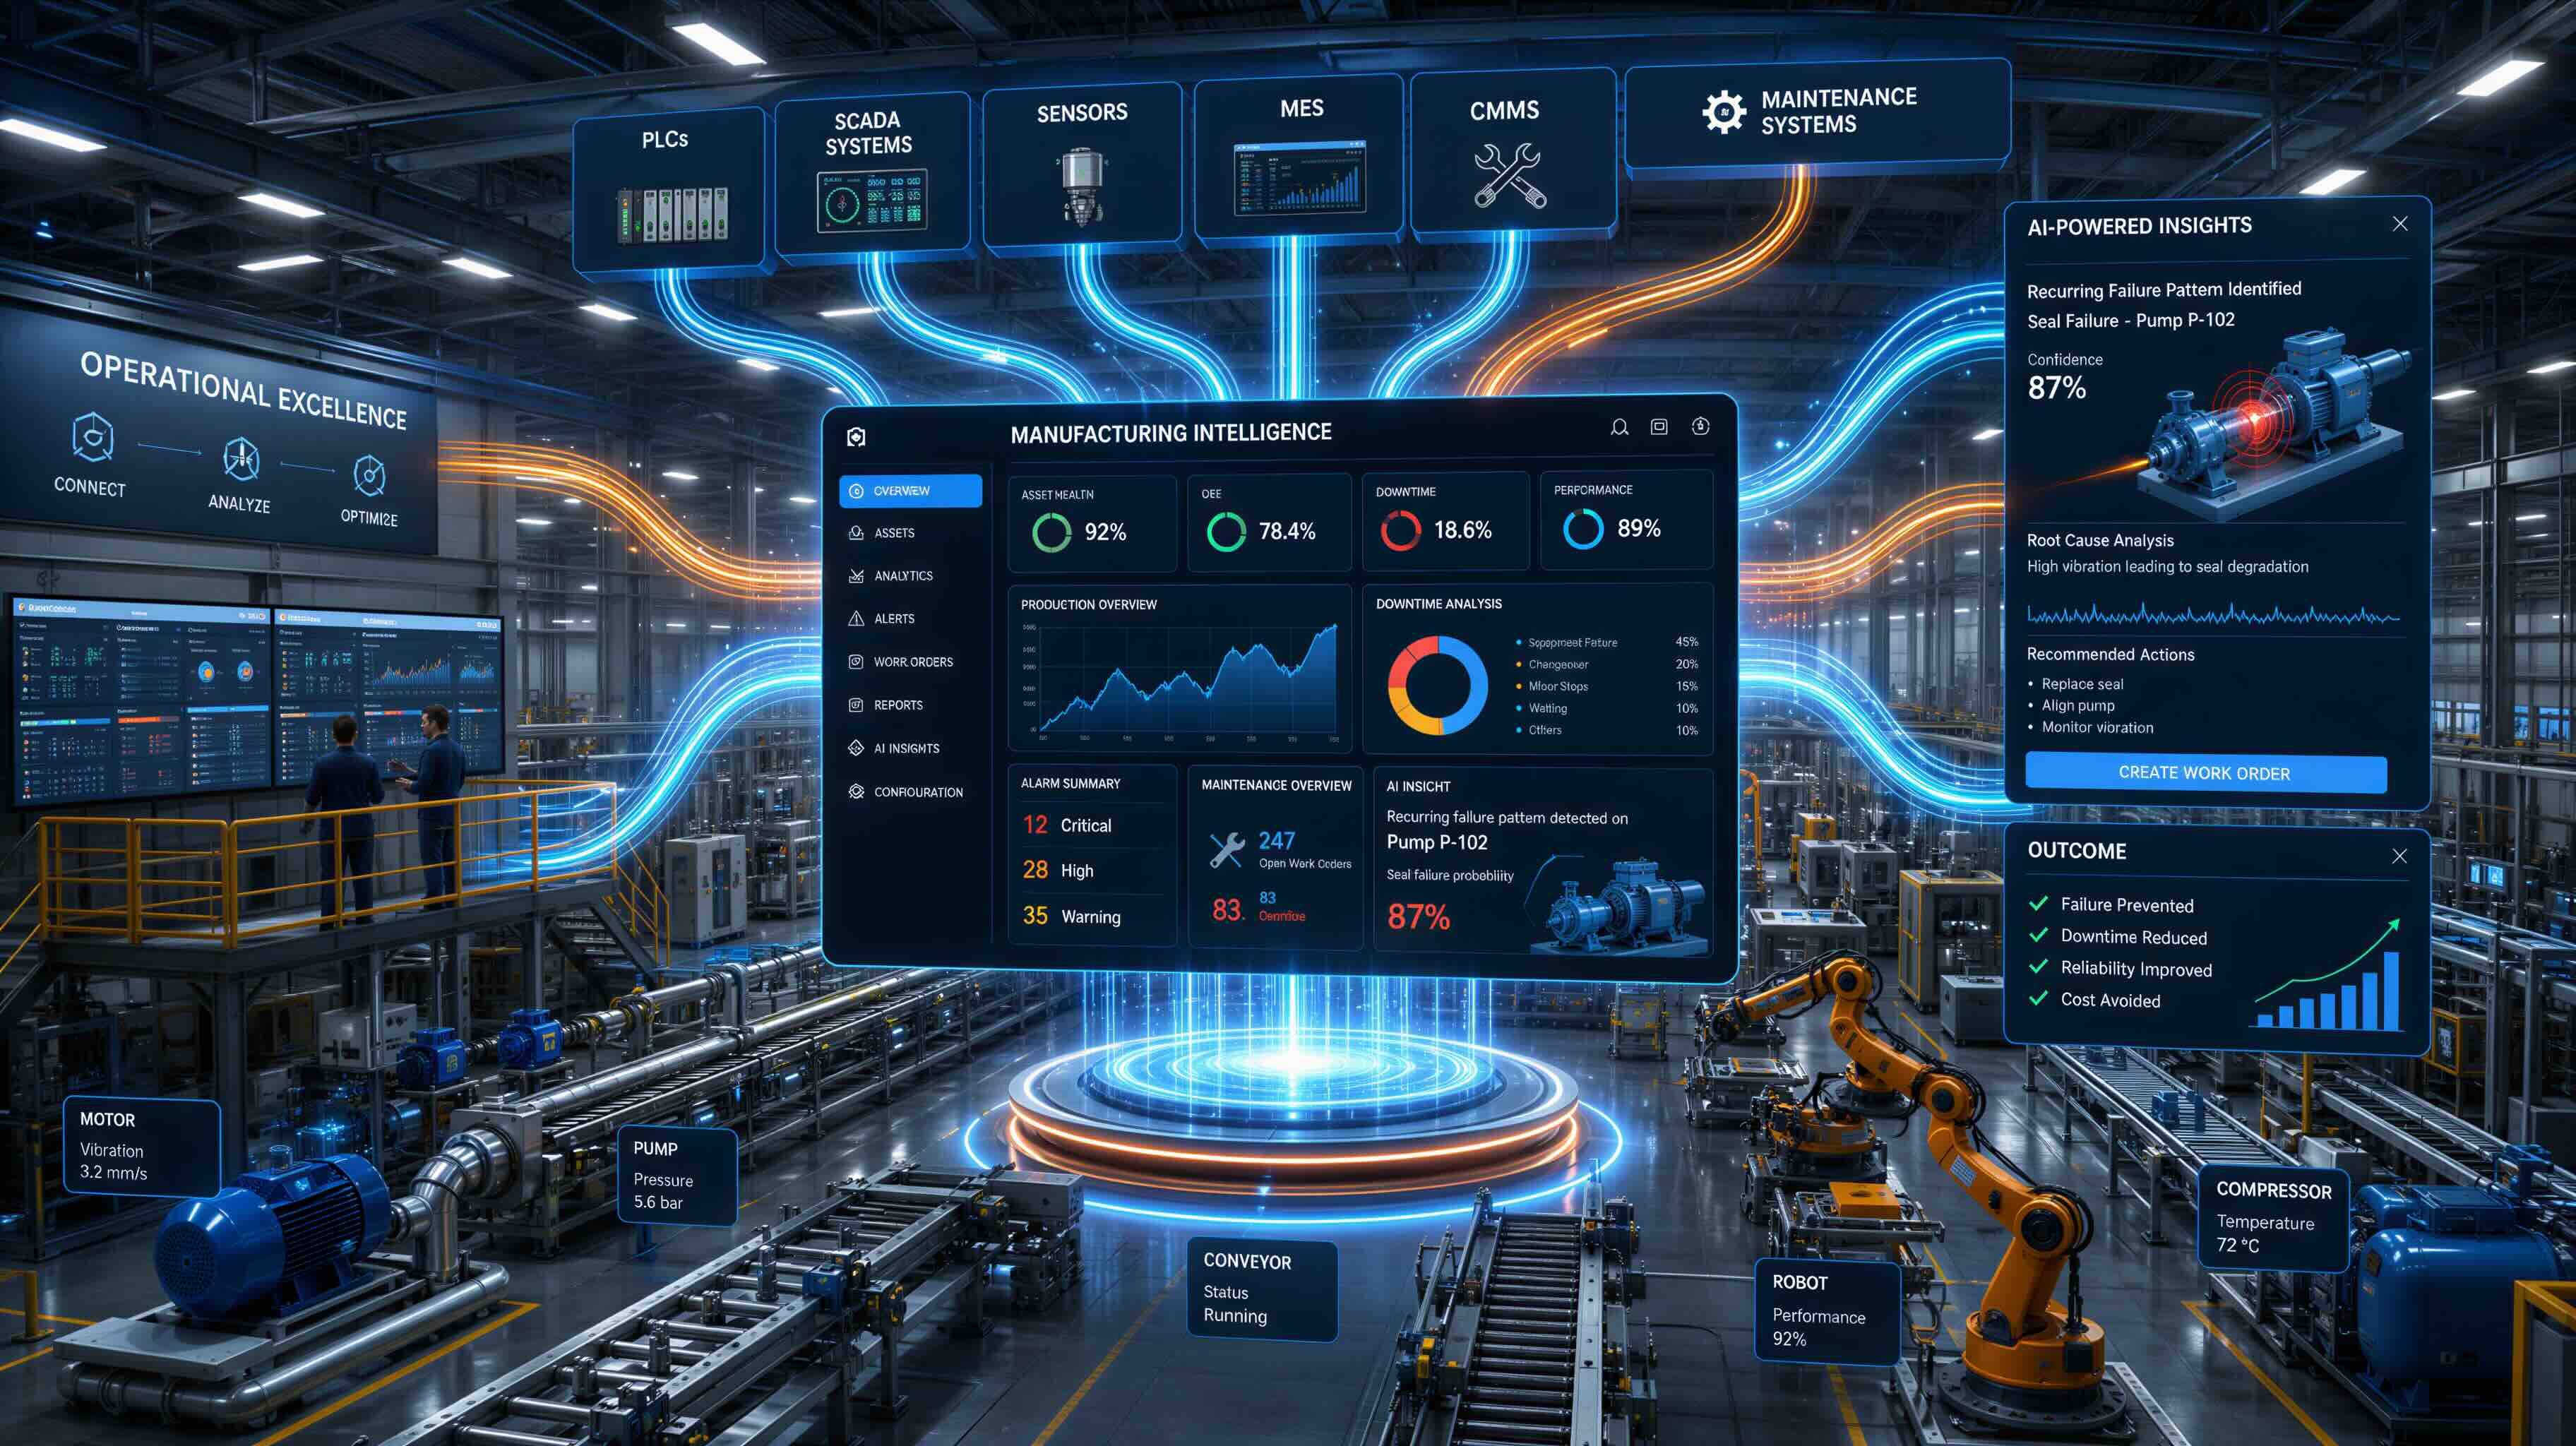

Most manufacturers have invested years connecting systems, building dashboards, and collecting data from PLCs, historians, MES, and ERP. The data exists. The infrastructure exists. What does not exist is a clear way to measure whether AI assistants for manufacturing operations are making frontline teams faster and more responsive.
That gap between deploying AI and proving its operational value is where many pilot programs stall. Leadership asks for ROI. Operations teams point to anecdotal improvements. Neither side has a measurement framework grounded in metrics that matter on the plant floor.
This guide covers how to baseline frontline productivity, select the right operational metrics, build a measurement framework, and connect AI assistant performance to outcomes your leadership team can act on.
B3 Systems built its operational intelligence platform to close exactly this kind of visibility gap. The principles here apply whether you are early in your AI journey or scaling across sites.
What Is Frontline Productivity in Manufacturing?
Frontline productivity measures how effectively operators, maintenance leads, engineers, and supervisors convert their time and expertise into operational outcomes. It is not the same as throughput or headcount efficiency. A line can hit its production target while frontline teams spend half their shift searching for information, manually classifying downtime, or waiting for direction.
The distinction matters because AI assistants target the operational work that surrounds production, not production itself. They reduce the time between a signal and an action. They surface relevant context so teams do not have to hunt for it across disconnected systems.
When you define frontline productivity in these terms, measurement becomes more precise. You are tracking how quickly teams respond, how accurately they diagnose, and how much of their shift goes toward planned work versus reactive firefighting.
Why Measuring AI Assistant Productivity Gains Is Difficult
Manufacturing operations are complex environments. Multiple variables change shift to shift, including product mix, crew composition, raw material quality, and equipment condition. Isolating the effect of an AI assistant from these factors requires deliberate baseline measurement.
Three common obstacles slow down measurement efforts:
- No pre-deployment baseline: Teams deploy AI assistants and then try to measure improvement retroactively. Without a documented starting point, any reported gain is difficult to validate.
- Inconsistent data collection: Different shifts, crews, and plants record information differently. Manual logs, paper forms, and incomplete MES entries create gaps that weaken any ROI analysis.
- Misaligned metrics: Leadership tracks financial KPIs. Operations tracks OEE and downtime. AI vendors track usage and adoption. These metrics rarely connect to each other in a way that shows cause and effect.
Addressing these obstacles is where the measurement framework starts.
How to Establish a Frontline Productivity Baseline
A baseline captures how your frontline teams perform before an AI assistant is active. It gives you the reference point that every ROI calculation depends on.
Step 1: Define the Scope
Select a specific line, cell, or area for your initial measurement. Narrow scope produces cleaner data. One line with consistent product mix and crew rotation is more useful than a plant-wide average that blends too many variables.
Step 2: Identify the Activities to Measure
Map the frontline activities that an AI assistant is expected to affect. Common categories include:
- Time spent investigating downtime root causes
- Time spent building or reviewing shift handover reports
- Time spent searching for historical production data
- Time spent manually classifying alarms or events
- Number of corrective actions completed per shift
Step 3: Collect Baseline Data for a Defined Period
Run your baseline measurement for a minimum of four to six weeks. This accounts for crew rotation cycles, product mix variation, and normal operational variability. Use a combination of MES data, operator logs, and time studies where automated data is not available.
Step 4: Document the Baseline in Operational Terms
Record your baseline using the same units you will use to measure improvement. If you are tracking time-to-resolution for downtime events, record it in minutes per event, not as a percentage or index. B3 Systems enables this by connecting data from PLCs, historians, MES, and ERP into a single platform where baseline metrics can be captured consistently.
Which Metrics to Track for AI Assistant Productivity ROI
Not every metric is relevant to every operation. The metrics below are organized into three categories: frontline efficiency, decision quality, and operational outcome.
Frontline Efficiency Metrics
These measure how much productive time AI assistants recover for frontline teams.
- Operator hours recovered per shift: The total time saved by replacing manual data searches, report generation, and event classification with AI-assisted responses.
- Time-to-action on downtime events: The elapsed time from when a stoppage is detected to when the first corrective action begins. AI assistants that surface root cause context can compress this from hours to minutes.
- Shift handover preparation time: How long it takes to prepare and deliver a shift handover summary. Automated summaries generated from operational data can reduce this to near zero.
Decision Quality Metrics
These track whether AI-assisted decisions lead to better outcomes than manual ones.
- First-time-right rate on corrective actions: The percentage of corrective actions that resolve the issue on the first attempt. Higher rates indicate that the AI assistant is surfacing accurate, relevant context.
- Alarm response accuracy: The percentage of alarms correctly classified and addressed versus false positives or misdiagnosed events.
- Downtime classification accuracy: How consistently and correctly downtime causes are recorded. AI-assisted classification reduces the variance between crews and shifts.
Operational Outcome Metrics
These connect frontline improvements to the KPIs leadership tracks.
- OEE improvement: A composite metric that reflects gains in availability, performance, and quality. Improvements in frontline response time and decision accuracy feed directly into OEE.
- Unplanned downtime reduction: Measured in minutes or hours per week. Faster response and better root cause analysis reduce the duration and recurrence of unplanned stops.
- First-pass yield: The percentage of product that meets quality standards on the first run. Better frontline access to process data and AI-assisted anomaly detection supports higher first-pass yield.
Building a Measurement Framework for AI Assistant ROI
A measurement framework connects your baseline, your selected metrics, and your reporting cadence into a repeatable process. Here is a step-by-step approach.
Step 1: Align Metrics to Business Objectives
Start by mapping each frontline metric to a business outcome that leadership cares about. Operator hours recovered maps to labor cost efficiency. Time-to-action on downtime maps to OEE and throughput. First-pass yield maps to quality cost reduction.
This alignment ensures that frontline measurement data answers the questions your leadership team is asking.
Step 2: Define Measurement Intervals
Track frontline metrics on a shift-by-shift and weekly basis. Report operational outcomes monthly. This cadence gives you enough data density to detect trends while keeping reporting manageable.
Step 3: Assign Accountability
Designate who owns each metric. Frontline metrics belong to operations supervisors and shift leads. Operational outcome metrics belong to the plant manager or operations director. AI adoption metrics belong to the team managing the deployment.
Step 4: Use a Connected Data Platform
Manual measurement is fragile. Spreadsheets drift. Reports get delayed. A connected operational intelligence platform that ingests data from your existing systems and calculates metrics automatically is the difference between a measurement framework that lasts and one that collapses after the first quarter.
B3 Systems connects data from PLCs, historians, MES, and ERP into a unified view, making it possible to calculate and track these metrics in real time across multiple industries and plant types.
Step 5: Compare Post-Deployment Data to Your Baseline
After the AI assistant has been live for the same duration as your baseline period, compare the two datasets. Use the same scope, the same metrics, and the same calculation methods. Any difference in methodology between baseline and post-deployment measurements invalidates the comparison.
Plant-Level Use Cases: Where AI Assistants Deliver Measurable Productivity Gains
The metrics above are most meaningful when tied to specific operational use cases. Here are four areas where measurement tends to be most clear-cut.
Downtime Root Cause Analysis
In a typical plant, investigating a downtime event involves pulling data from multiple systems, cross-referencing alarm histories, and consulting with operators who were on shift when the event occurred. This process can take days.
An AI assistant that connects alarm data, process parameters, and maintenance records compresses this investigation to minutes. The measurable outcome: time-to-resolution drops, recurring loss drivers are identified faster, and the same events stop repeating.
Shift Handover Quality
Poor handovers create blind spots. Incoming crews miss context about what happened on the previous shift, leading to repeated mistakes and slower ramp-up. An AI assistant that auto-generates handover summaries from operational data eliminates the information gap.
Measurement tracks handover preparation time and the number of incidents attributable to missing handover information. Both should decline after deployment.
Alarm Management and Triage
Standing alarms, nuisance alarms, and alarm floods consume operator attention without driving productive action. An AI assistant that classifies, prioritizes, and recommends responses to alarms recovers operator hours and improves response accuracy.
In one North American pulp and paper operation, this type of analysis identified 15,721 alarm events that could be reduced, recovering 1,237 operator hours and surfacing 342 automation opportunities.
Operational Q&A and Data Access
How much time do engineers and supervisors spend pulling reports, building pivot tables, and answering ad-hoc questions from leadership? An AI assistant that answers operational questions in plain language, grounded in real production data, replaces hours of manual analysis with immediate, evidence-based responses.
B3 Systems built B3rry as an AI assistant and agent layer specifically for this purpose. It connects to your operational data, reasons through what happened, and surfaces recommendations your teams can review and act on.
How to Differentiate AI Assistant Measurement from Dashboard Analytics
A common mistake is treating AI assistant measurement as a dashboard exercise. Dashboards show what happened. Measurement frameworks answer a different question: did the AI assistant change what happened?
The difference is attribution. A dashboard might show that OEE improved by two points over a quarter. A measurement framework traces that improvement back to specific frontline actions, such as faster downtime response or more accurate alarm classification, that the AI assistant enabled.
This distinction matters when justifying ongoing investment. Leadership needs to see the causal chain, not just a trend line. Connect the systems, see performance in real time, and tie improvements to specific AI-assisted decisions.
Scaling Productivity Measurement Across Multiple Plants
Once you have a working measurement framework at one site, the challenge shifts to replication. Scaling measurement across plants introduces new variables: different equipment, different crews, different product mixes, and different levels of data maturity.
Standardize Metric Definitions
If Plant A defines "unplanned downtime" differently than Plant B, your cross-site comparison is meaningless. Publish a measurement standard that defines each metric precisely, including calculation methods, data sources, and exclusions.
Normalize for Operational Differences
Raw numbers across plants are not directly comparable. A packaging line and a pulp machine have different cycle times, different failure modes, and different crew structures. Normalize metrics to per-shift, per-line, or per-event rates so comparisons are valid.
Use a Centralized Data Platform
Multi-plant measurement requires a platform that ingests data from each site and applies consistent calculations. B3 Systems supports this by connecting to the existing infrastructure at each plant, standardizing data across sources, and delivering role-based views for operators, engineers, and leadership.
Common Mistakes When Measuring AI Assistant ROI
Avoid these pitfalls to keep your measurement framework credible.
- Measuring too early: AI assistants need time to ingest data, learn operational patterns, and gain adoption. Measuring ROI in the first two weeks produces misleading results. Allow the same duration as your baseline period before drawing conclusions.
- Ignoring adoption: An AI assistant that only 30% of the crew uses will not deliver plant-wide productivity gains. Track adoption by crew, shift, and role alongside productivity metrics.
- Conflating correlation with causation: A quarter with fewer downtime events might coincide with a new product launch that ran smoother equipment. Your framework should include controls that account for confounding variables.
- Overlooking qualitative gains: Some improvements, like reduced cognitive load on operators or faster onboarding for new hires, are harder to quantify but real. Include qualitative feedback from frontline teams as a supplement to quantitative data.
How Human-in-the-Loop Workflows Strengthen Productivity Measurement
AI assistants that operate as human-in-the-loop decision support systems produce more measurable outcomes than those that automate decisions in the background. When a recommendation is surfaced, reviewed, and acted on by an operator or engineer, the decision chain is traceable.
That traceability is measurement gold. You can count how many recommendations were surfaced, how many were accepted, how many led to a corrective action, and what the outcome was. Each step in the chain is a data point.
B3 Systems designs its AI-assisted workflows this way by intention. Recommendations come with context, evidence, and a traceable chain. The operator reviews, questions, and acts. That interaction generates the data your measurement framework needs.
According to a 2025 McKinsey survey of manufacturing COOs, 93% of respondents plan to increase AI spending, yet only 2% report AI fully embedded across operations. That gap underscores why structured measurement matters.
Connecting Productivity Measurement to Scalable AI Deployment
Measurement is not an end in itself. The purpose is to build the evidence base that justifies scaling AI deployment from one line to one plant to an entire network.
A strong measurement framework answers three questions at each stage:
- Did the AI assistant improve frontline performance on the pilot line? Compare baseline to post-deployment data using the metrics and framework described above.
- Are the gains transferable to other lines or areas? Run a second baseline at the next site and repeat the measurement. Consistent gains across different contexts build confidence.
- What is the estimated operational value at scale? Multiply per-line or per-plant gains by the number of sites, adjusted for differences in complexity. Use qualified language: "estimated annual operational opportunity," not guaranteed returns.
This approach mirrors how B3 Systems approaches deployment: start with one line, one recurring loss driver, one measurable outcome. Build the evidence. Then scale.
In Conclusion: How to Measure Frontline Productivity Gains from AI Assistants
Measuring frontline productivity gains from AI assistants in manufacturing is not a reporting exercise. It is an operational discipline. It starts with a clear baseline, focuses on metrics that connect frontline actions to business outcomes, and uses a connected data platform to keep measurement consistent over time.
The operations that succeed in scaling AI are the ones that can show, with traceable evidence, what improved and why. That is the role of a measurement framework grounded in operational reality.
If your team is evaluating how to measure AI assistant productivity in your operation, B3 Systems can help you connect the data, build the baseline, and track the outcomes. See B3 in Action.
FAQs about The Complete Guide to AI Assistant Productivity ROI
What is the most important metric for measuring AI assistant ROI in manufacturing?
Time-to-action on downtime events is one of the most direct indicators. It measures how quickly your frontline team moves from detecting a problem to beginning a corrective action. B3 Systems tracks this metric across connected plant-floor data to give operations leaders a clear, traceable measure of improvement.
How long should a productivity baseline run before deploying an AI assistant?
Four to six weeks is the recommended minimum. This duration accounts for crew rotation, product mix changes, and normal operational variability. Running a shorter baseline risks capturing an unrepresentative snapshot that weakens your ROI analysis.
Can AI assistant productivity gains be measured across multiple plants?
Yes, if you standardize metric definitions and use a centralized data platform. B3 Systems connects to existing infrastructure at each site, normalizes data from PLCs, MES, ERP, and historians, and applies consistent calculations so cross-plant comparisons are valid.
What is the difference between dashboard analytics and a measurement framework?
Dashboards show what happened. A measurement framework traces improvements back to specific AI-assisted decisions and actions. B3 Systems supports this by making every recommendation traceable, so you can connect frontline actions to operational outcomes with evidence.
How does human-in-the-loop AI support better productivity measurement?
When operators review and act on AI recommendations, every step creates a data point: recommendations surfaced, accepted, acted on, and resolved. B3 Systems designs its AI-assisted workflows with this traceability built in, giving measurement frameworks the granular data they need.
What mistakes should teams avoid when measuring AI assistant ROI?
The most common mistake is measuring too early, before the AI assistant has enough data and adoption to reflect its impact. Other pitfalls include inconsistent metric definitions across shifts or plants and conflating correlation with causation when external variables change.